Uniform width
The channel keeps a similar width up to the coastline.
Territorial resilience
Research / AA Design Research Laboratory / 2024
How can coastal cities grow with water, rather than simply defend against it?
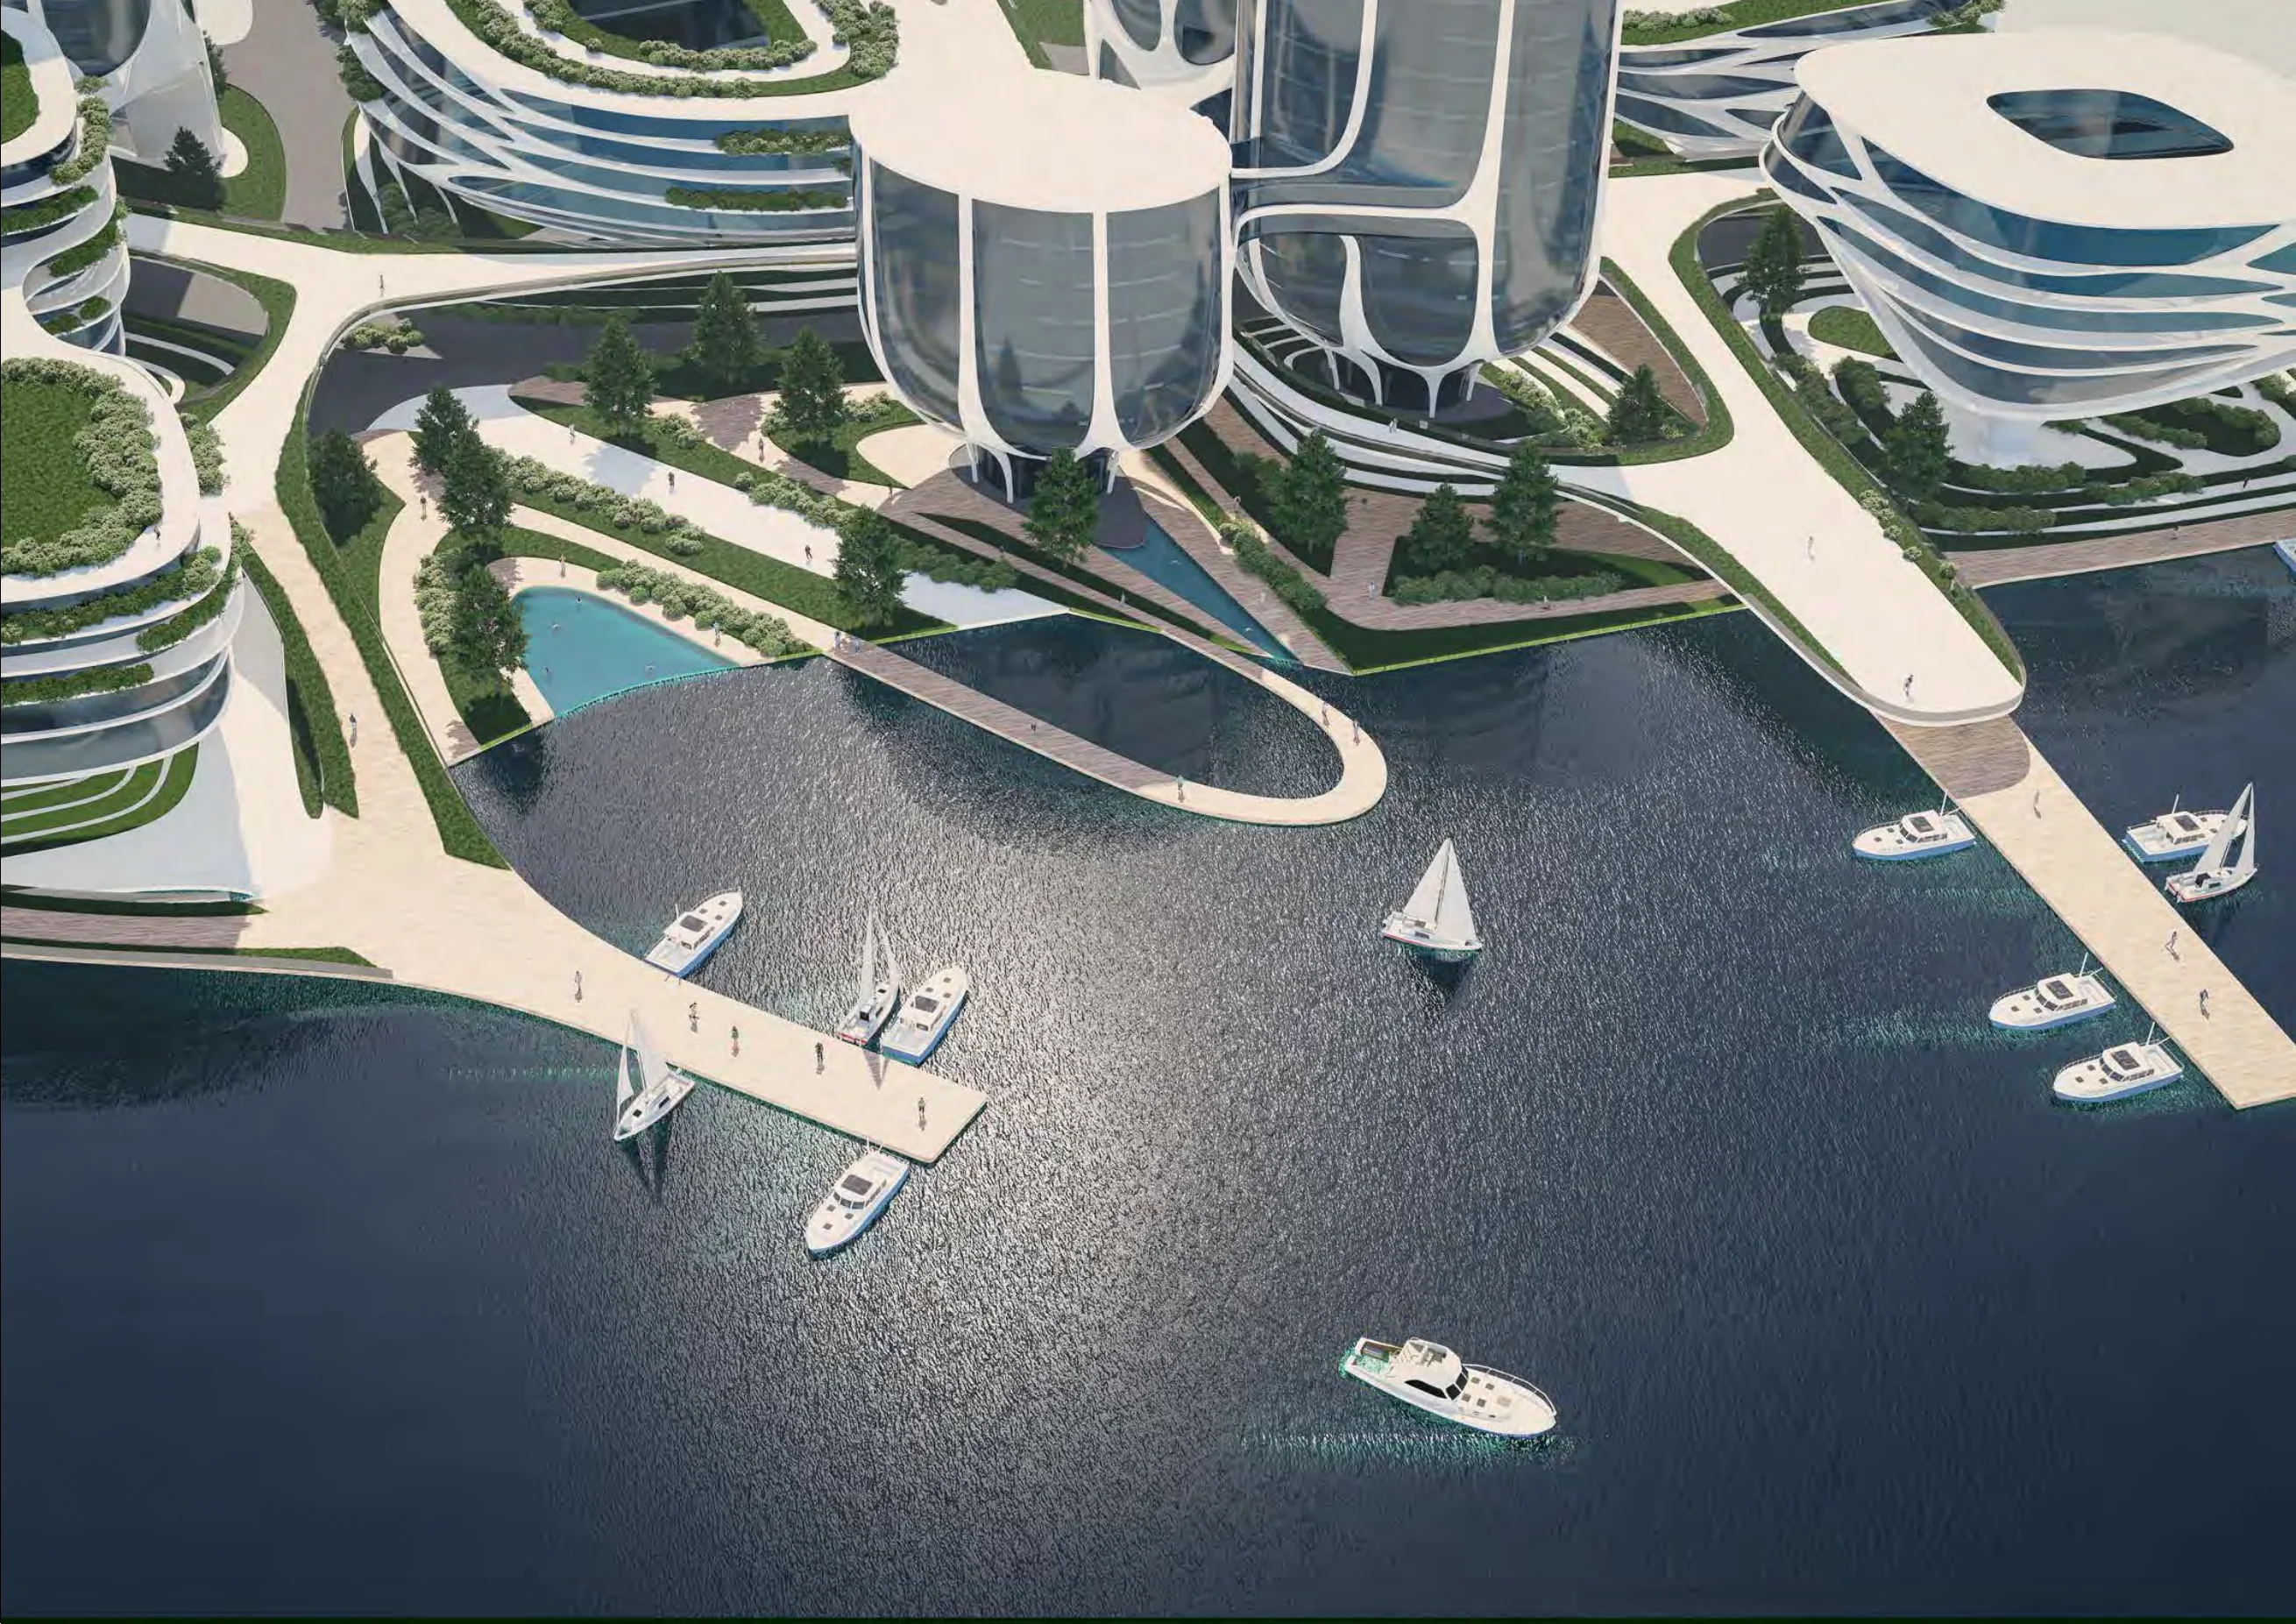 Project visualisation / portfolio page 4
Research overview
This academic group study connects land-use decisions, physical water tests and waterfront design.
Research: Ashwin Rajendran · Nishtha Gupta · Sidharth Tayal
An academic design investigation, not a built development. Original research plates and full team credits accompany the illustrated guides.
How the model works
Land, rent and tax connect development to shared infrastructure.
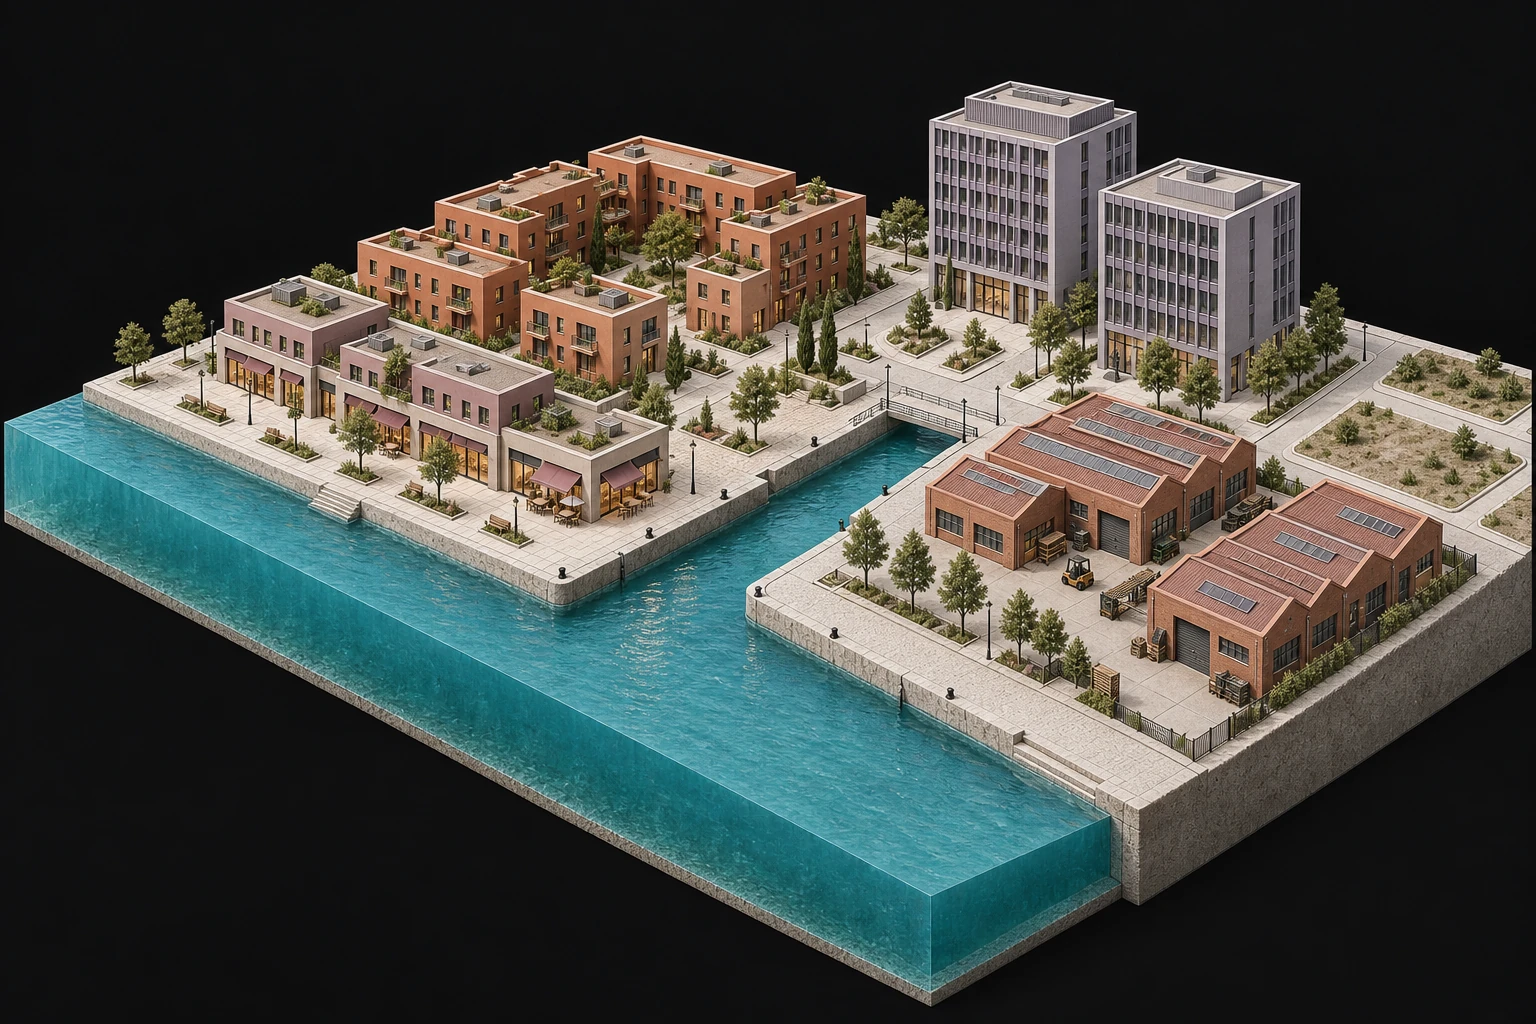
Different uses share the same streets, land and waterfront.
Representatives choose whether to buy land, build or skip their turn.
Land and construction use a budget. Development changes surrounding land values.
Rent generates income; maintenance and tax are costs. Tax goes to the communal actor.
Communal resources pay for shared infrastructure, changing access and opportunities.
The next decision starts with different buildings, access and land values.
The cycle repeats: the changed city shapes the next move.
Inside the study
Read the guides, then inspect the original plates.
Communal, residential, industrial, commercial and office representatives make different decisions about land, construction and shared infrastructure. These actions show one round of the model.
Reading: Compare each development move with its costs and effects on shared resources.
Infrastructure built; tax collected.
Land bought.
Land bought; construction.
Pass.
Construction.
Editorial illustrations of five roles, not simulation results. Actions shown are one round from portfolio page 3, not fixed rules.
Inspect the original economic plateThe study treats the canal mouth, bends and branches as design variables, then compares them with water speed and flooding.
Reading: Test geometry against water response; these comparisons do not identify one universally best canal shape.
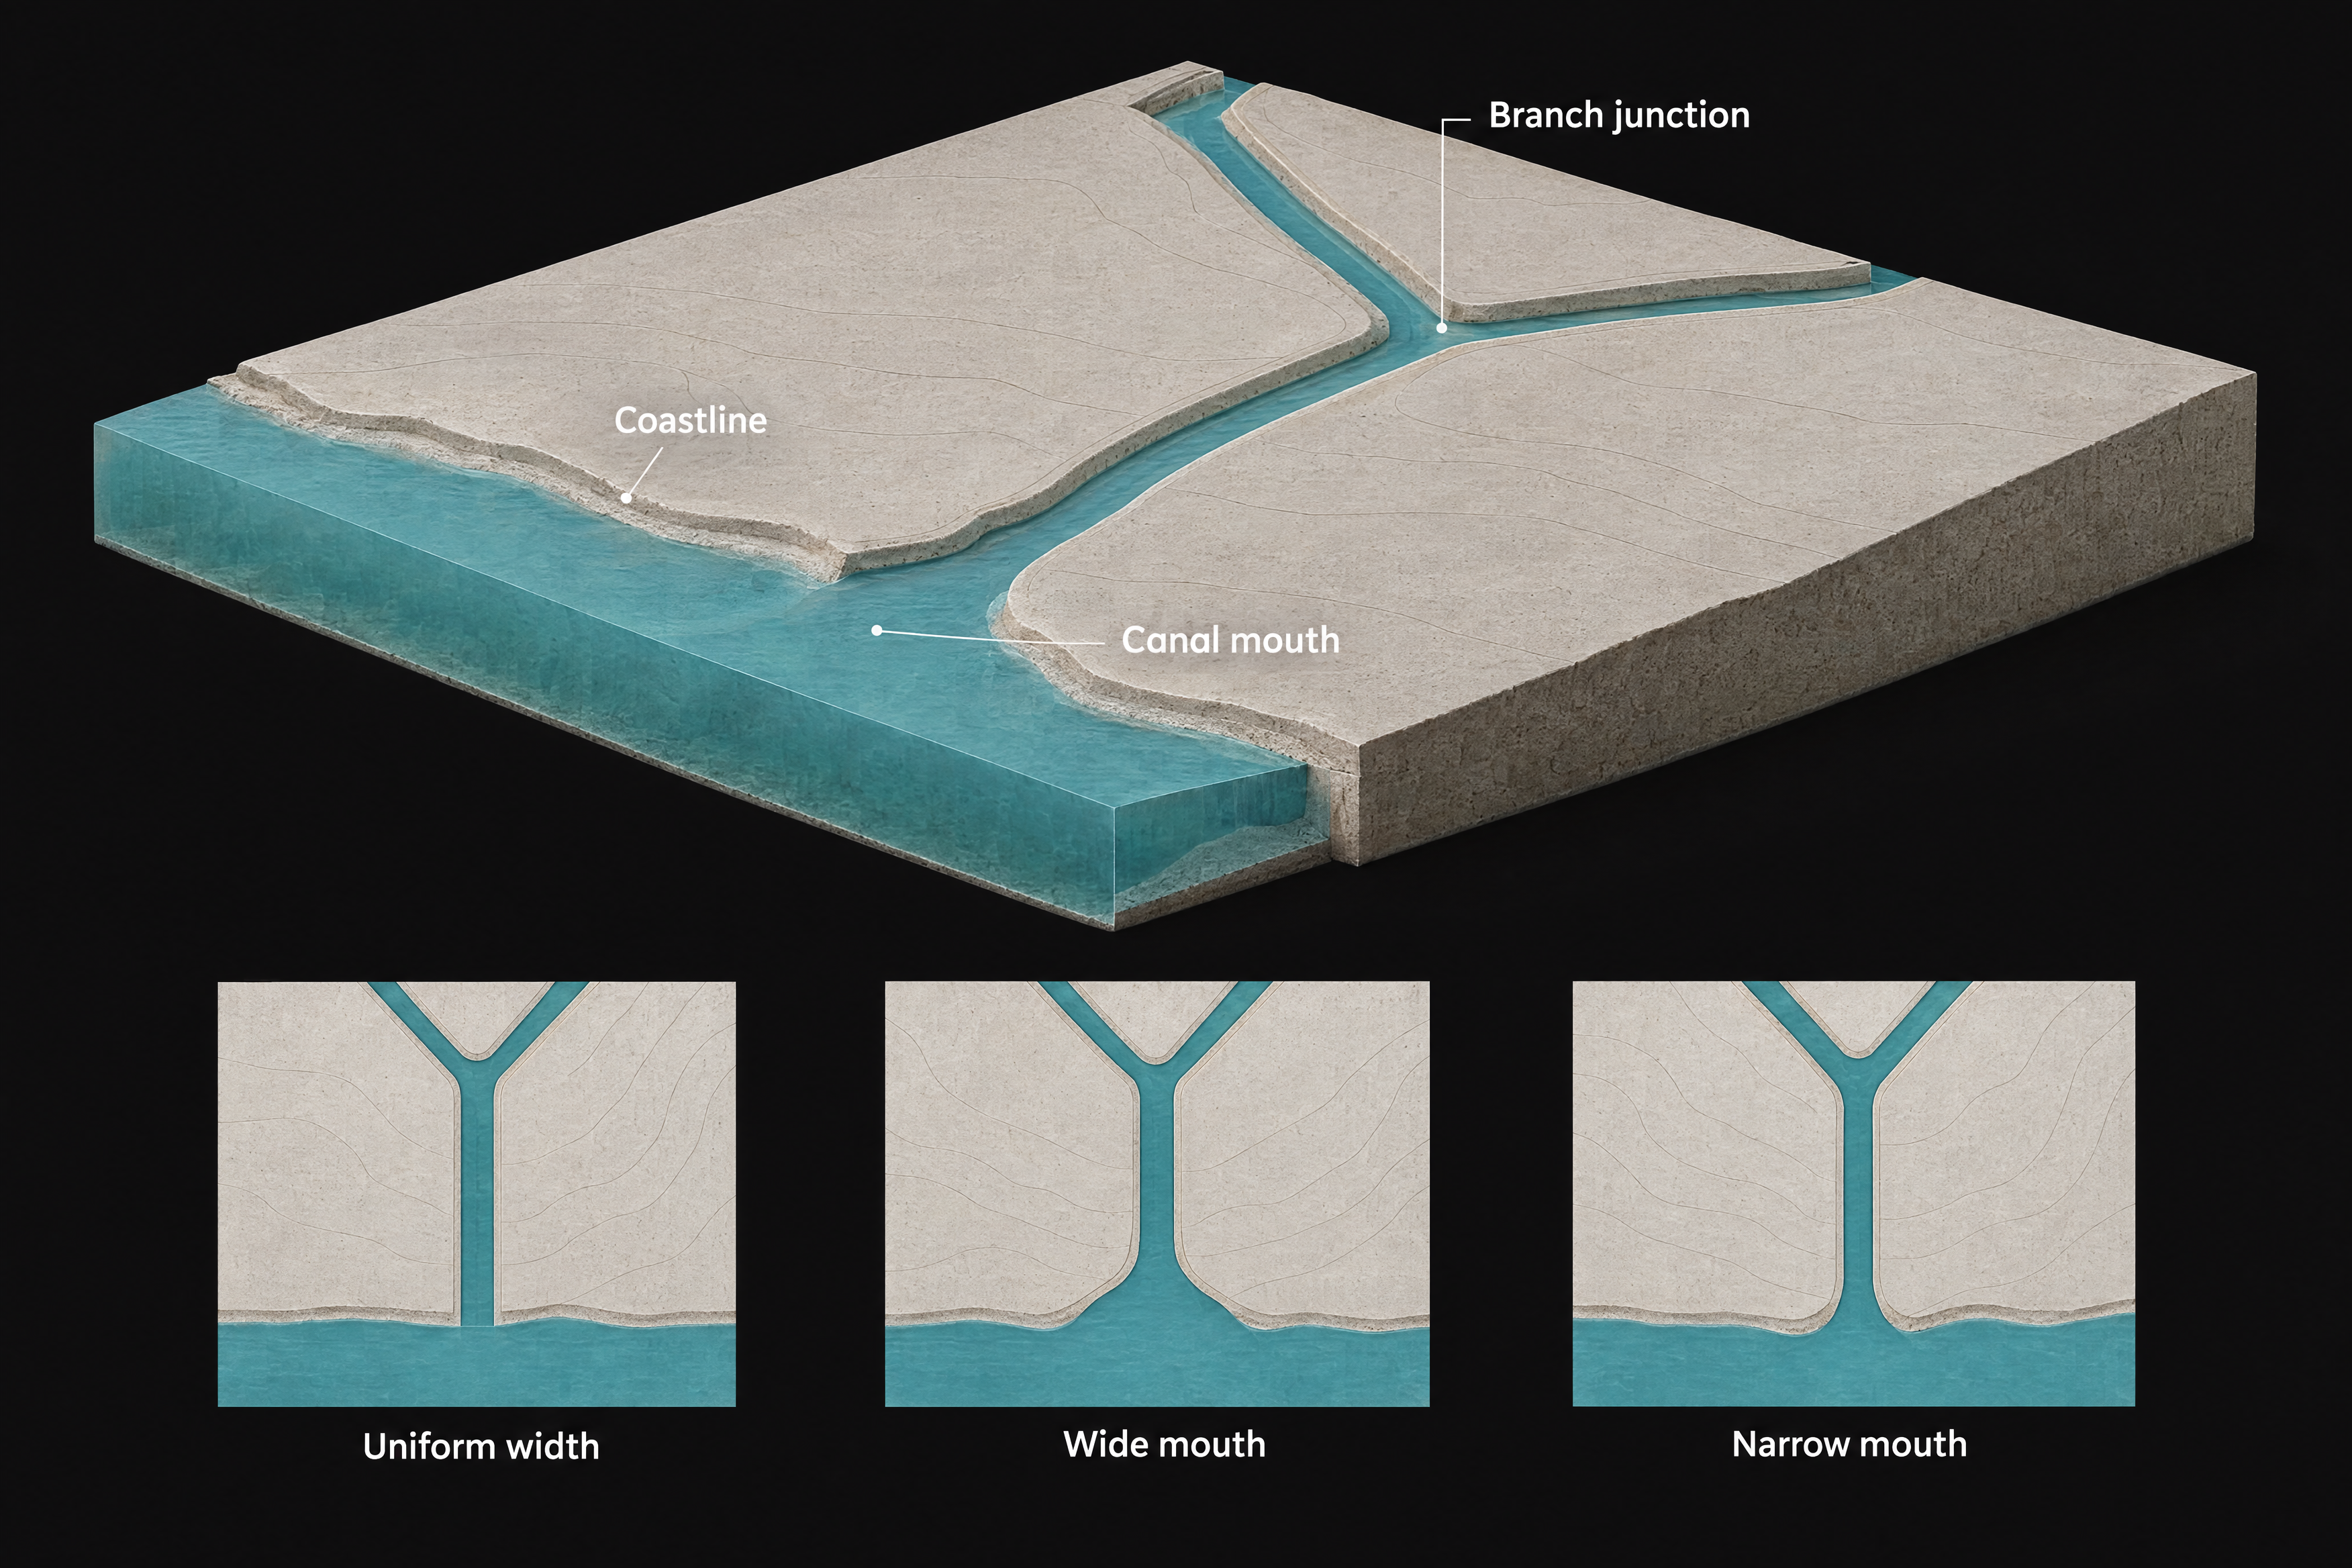
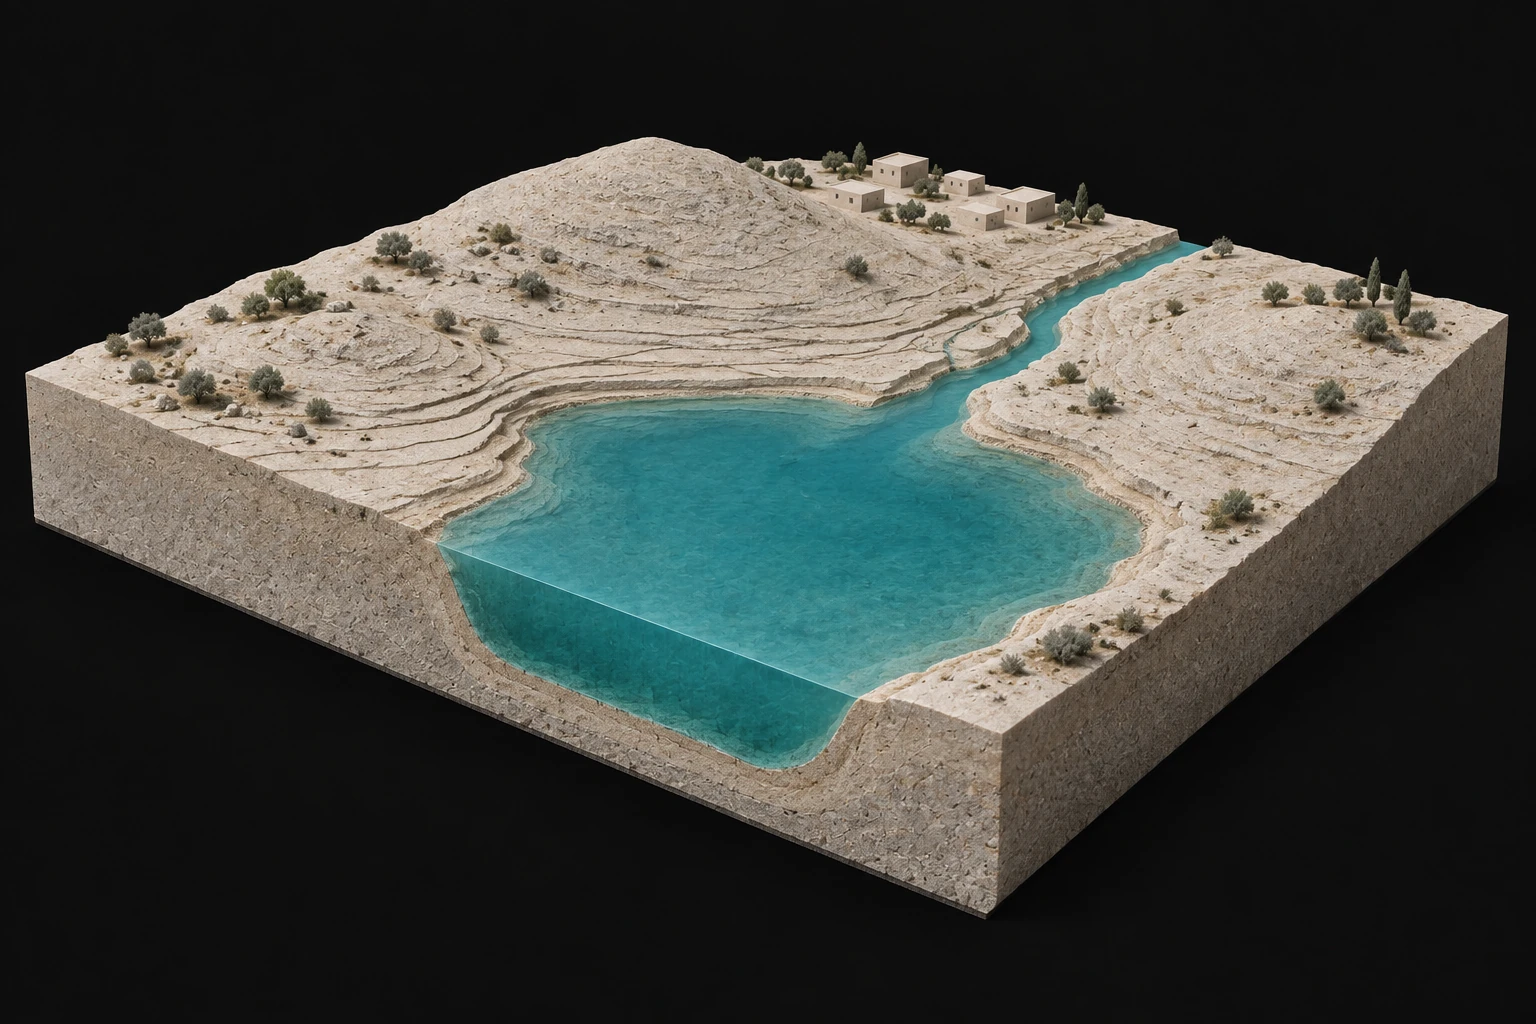
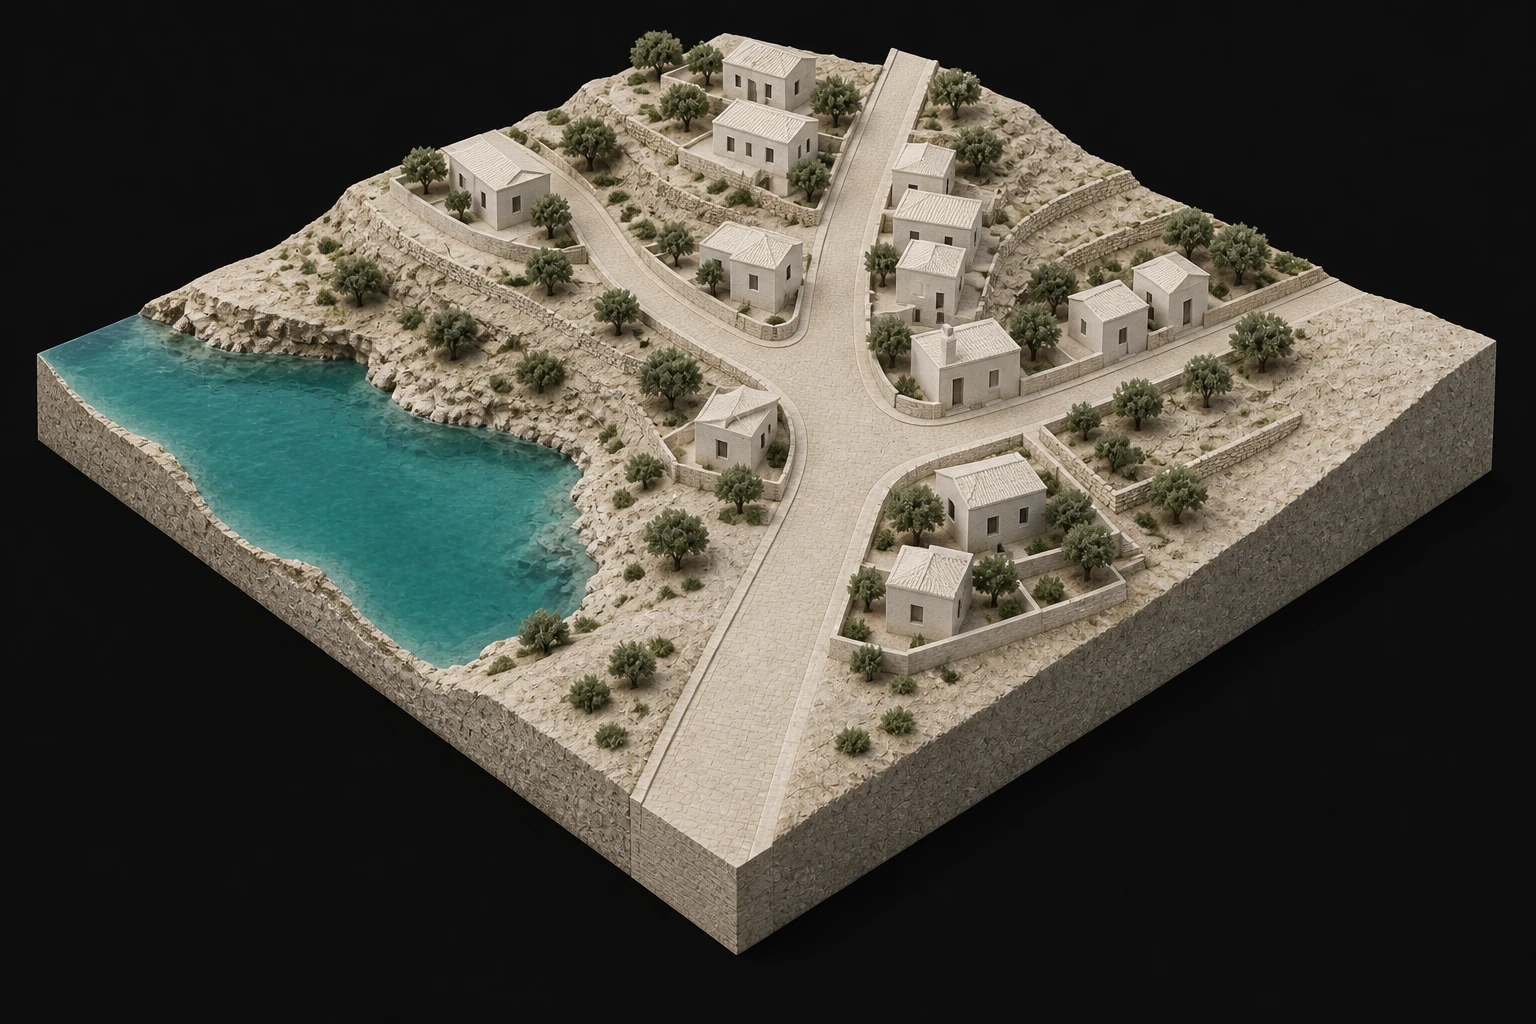
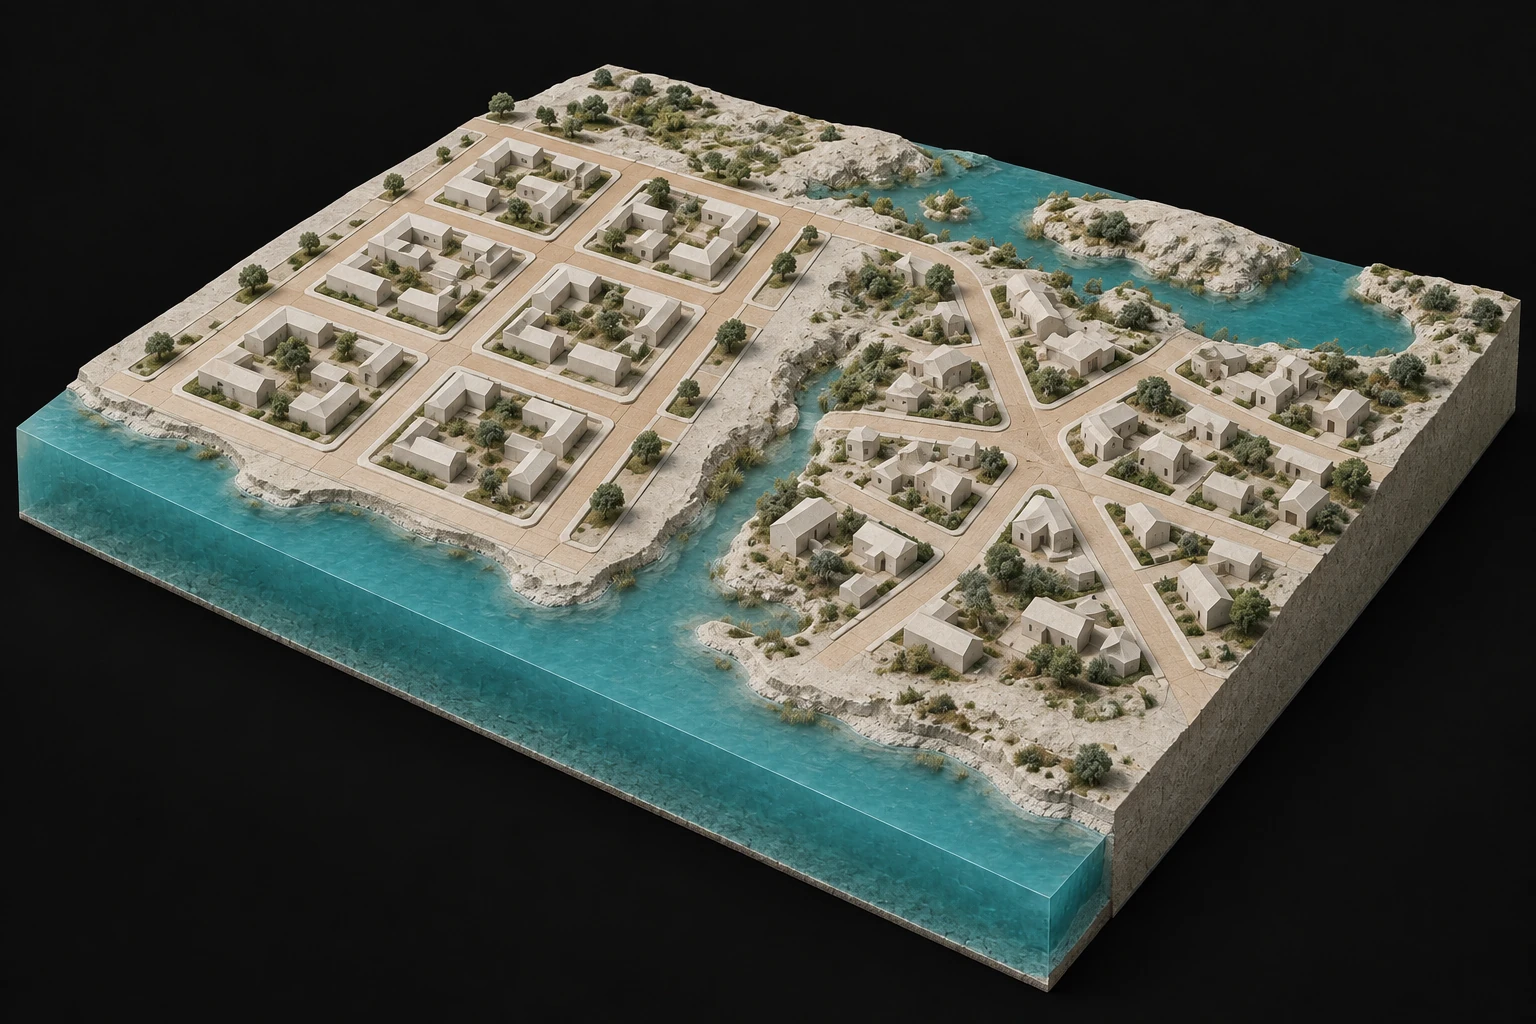
Read the coastline, the opening and the junction together. Compare the three plans below.
The channel keeps a similar width up to the coastline.
The banks open out towards the sea.
A slimmer channel leads to a smaller coastal opening.
Reading guide · Editorial illustration of canal geometry studied in portfolio page 7. Terrain and water are illustrative, not a measured site or simulation output. The complete original plate remains below.
The complete original plate is shown here. Fine detail remains limited because the portfolio embeds the diagrams at low resolution.
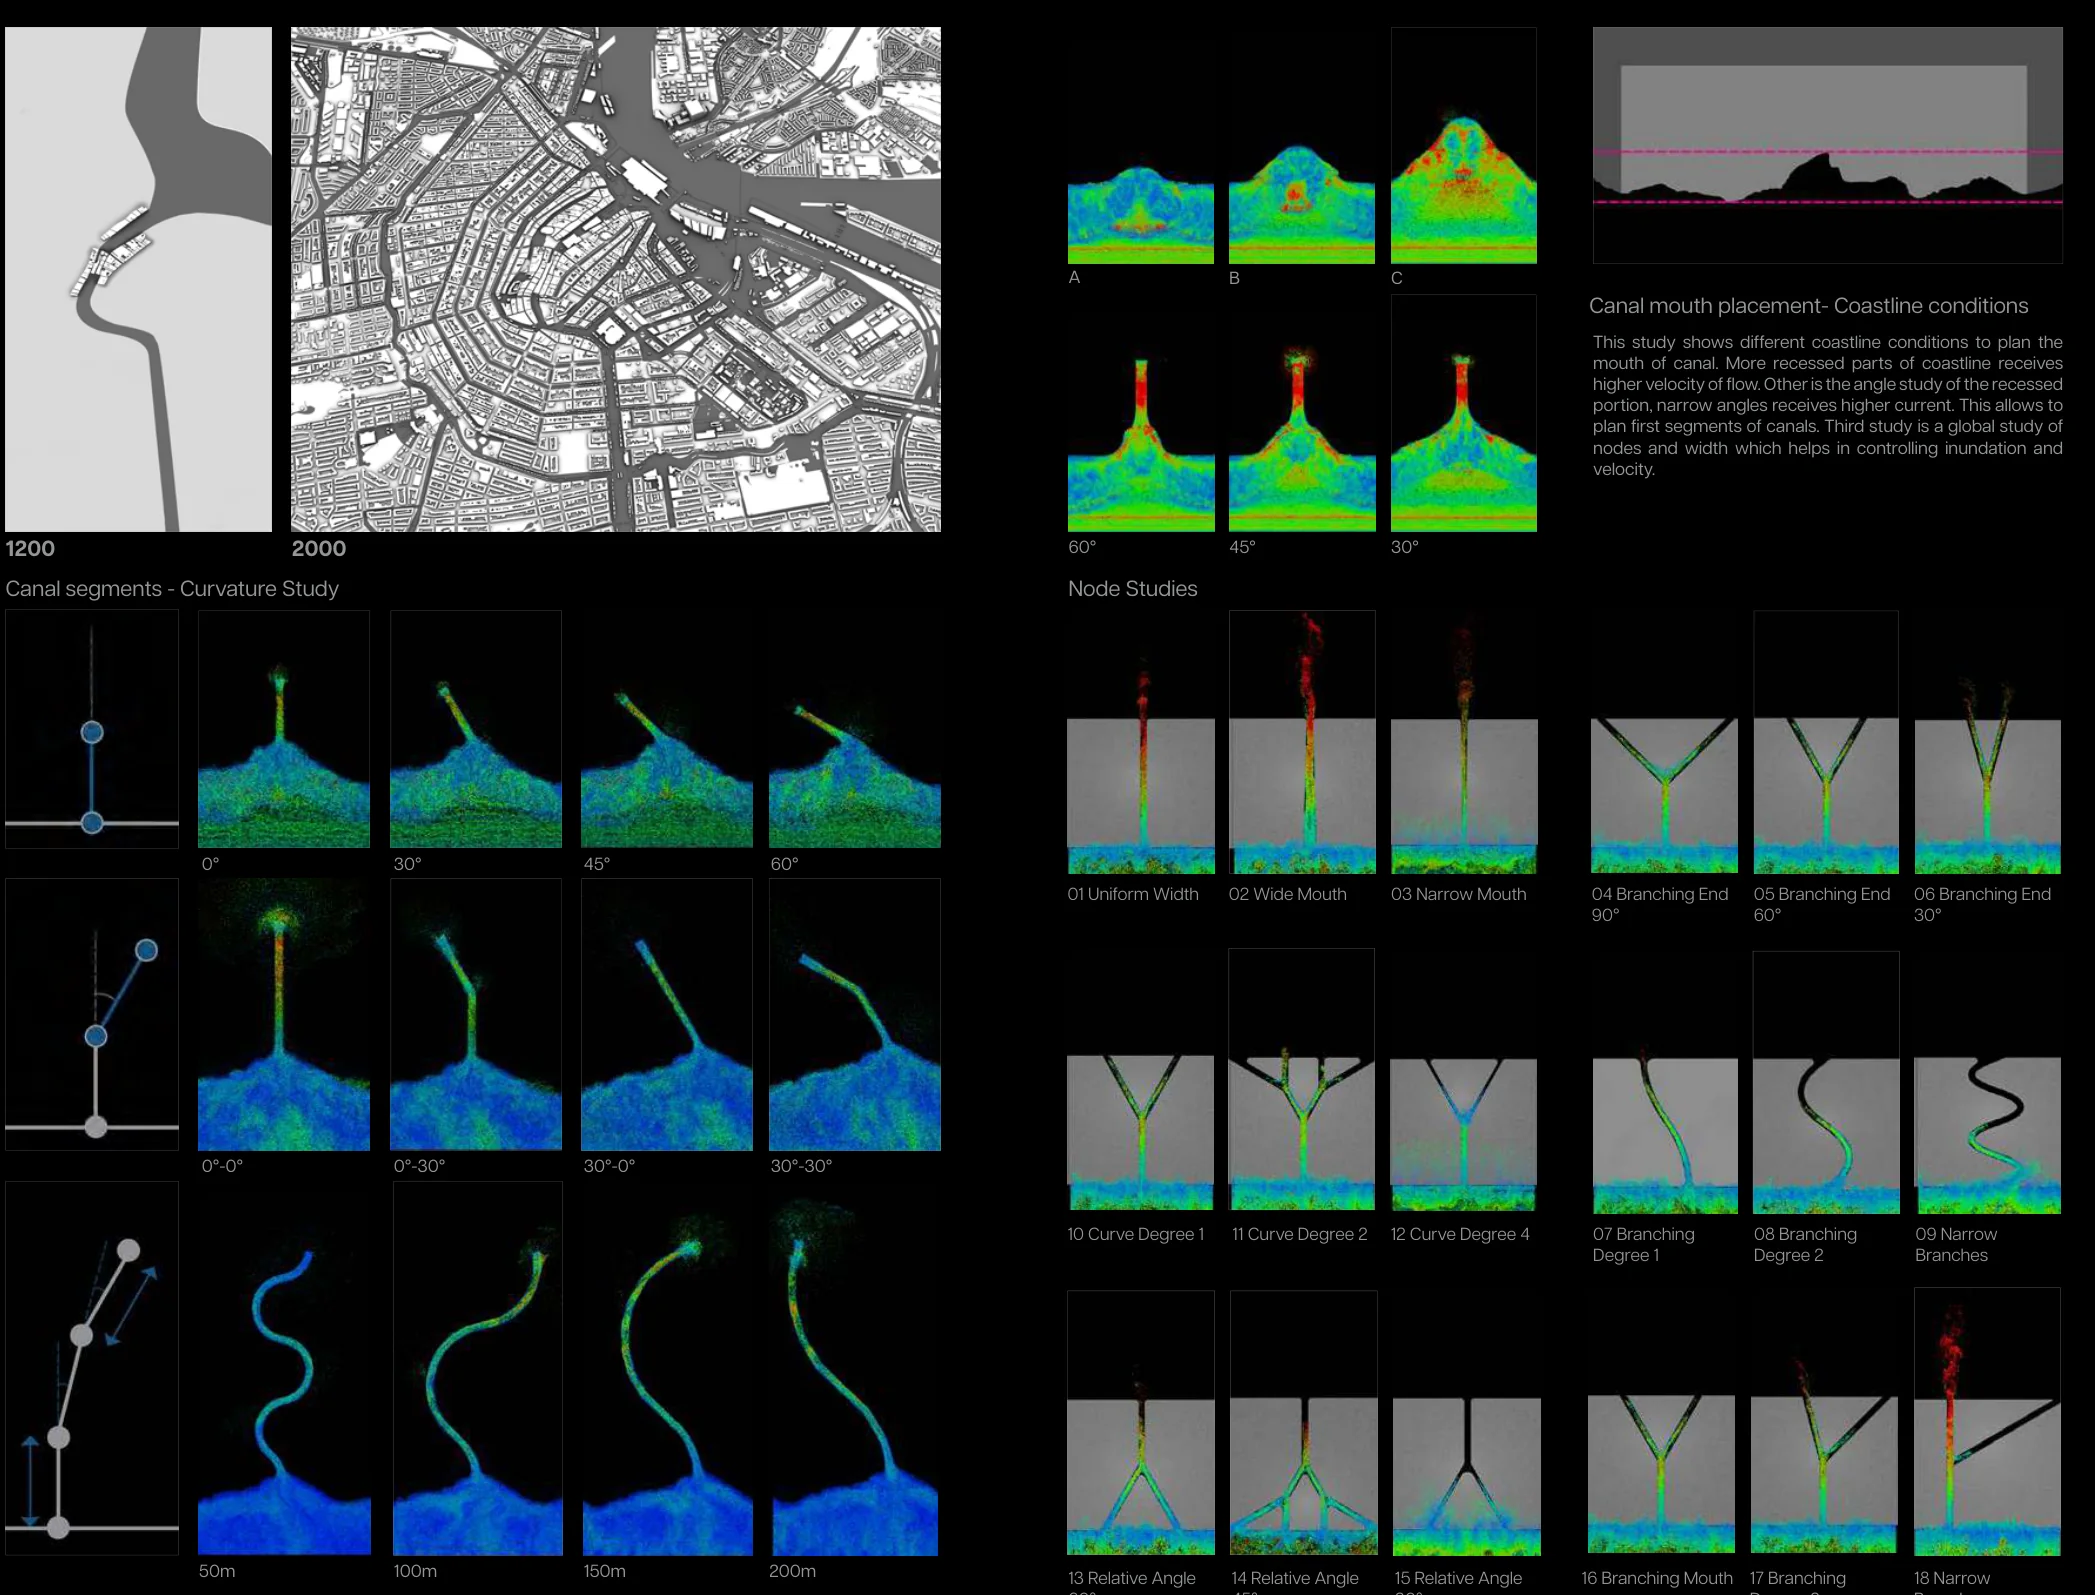 Open original image separately
Five terrain iterations are tested in a 1200 × 900 millimetre tank under water current, inundation and stormwater conditions, revealing recurring low points where water collects.
Reading: Model-scale water accumulation identifies conditions to examine, not evidence of flood safety for a real district.
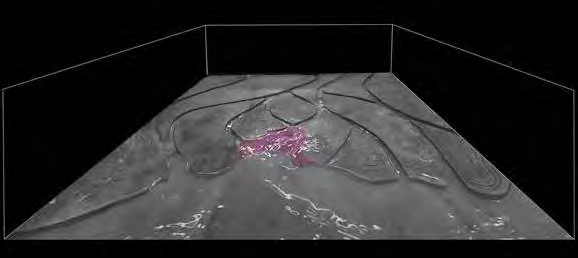
Water reaches the recessed coastline in the physical terrain model.
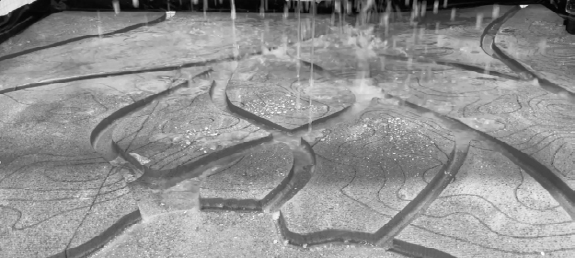
Rainfall is applied to test drainage through the canal network.
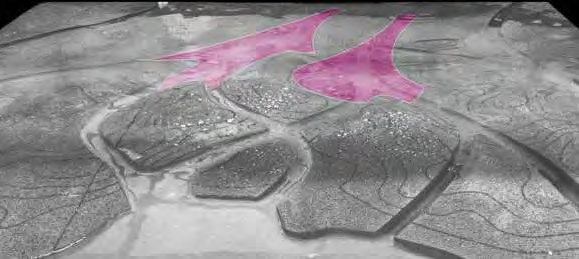
The source identifies recurring areas where water collects across the tested conditions.
Portfolio page 8 · Selected physical test photographs. The complete plate includes all five terrain iterations.
Open the complete original plateThe street study uses areas of accumulated water to guide street growth. It compares a constrained grid with networks that allow more freedom to branch.
Reading: Compare grid and branching organisation; a more complex pattern is not automatically a better one.
Begin with the terrain, look at the direction a street can take, then compare the pattern made by many streets.
01
The low ground holds water. In the study, areas of accumulated water guide where streets grow.
02
The growth angle controls how freely the next street can change direction. Read the junction, not just the route's endpoint.
03
Repeated rules create a network. Compare the regular blocks on the left with the more varied junctions and plots on the right.
Reading guide · Editorial illustrations explain terrain, growth direction and network form studied in portfolio page 9. They are not simulation outputs or measured flood predictions. The original comparisons remain below.
The complete original plate is shown here. Fine detail remains limited because the portfolio embeds the diagrams at low resolution.
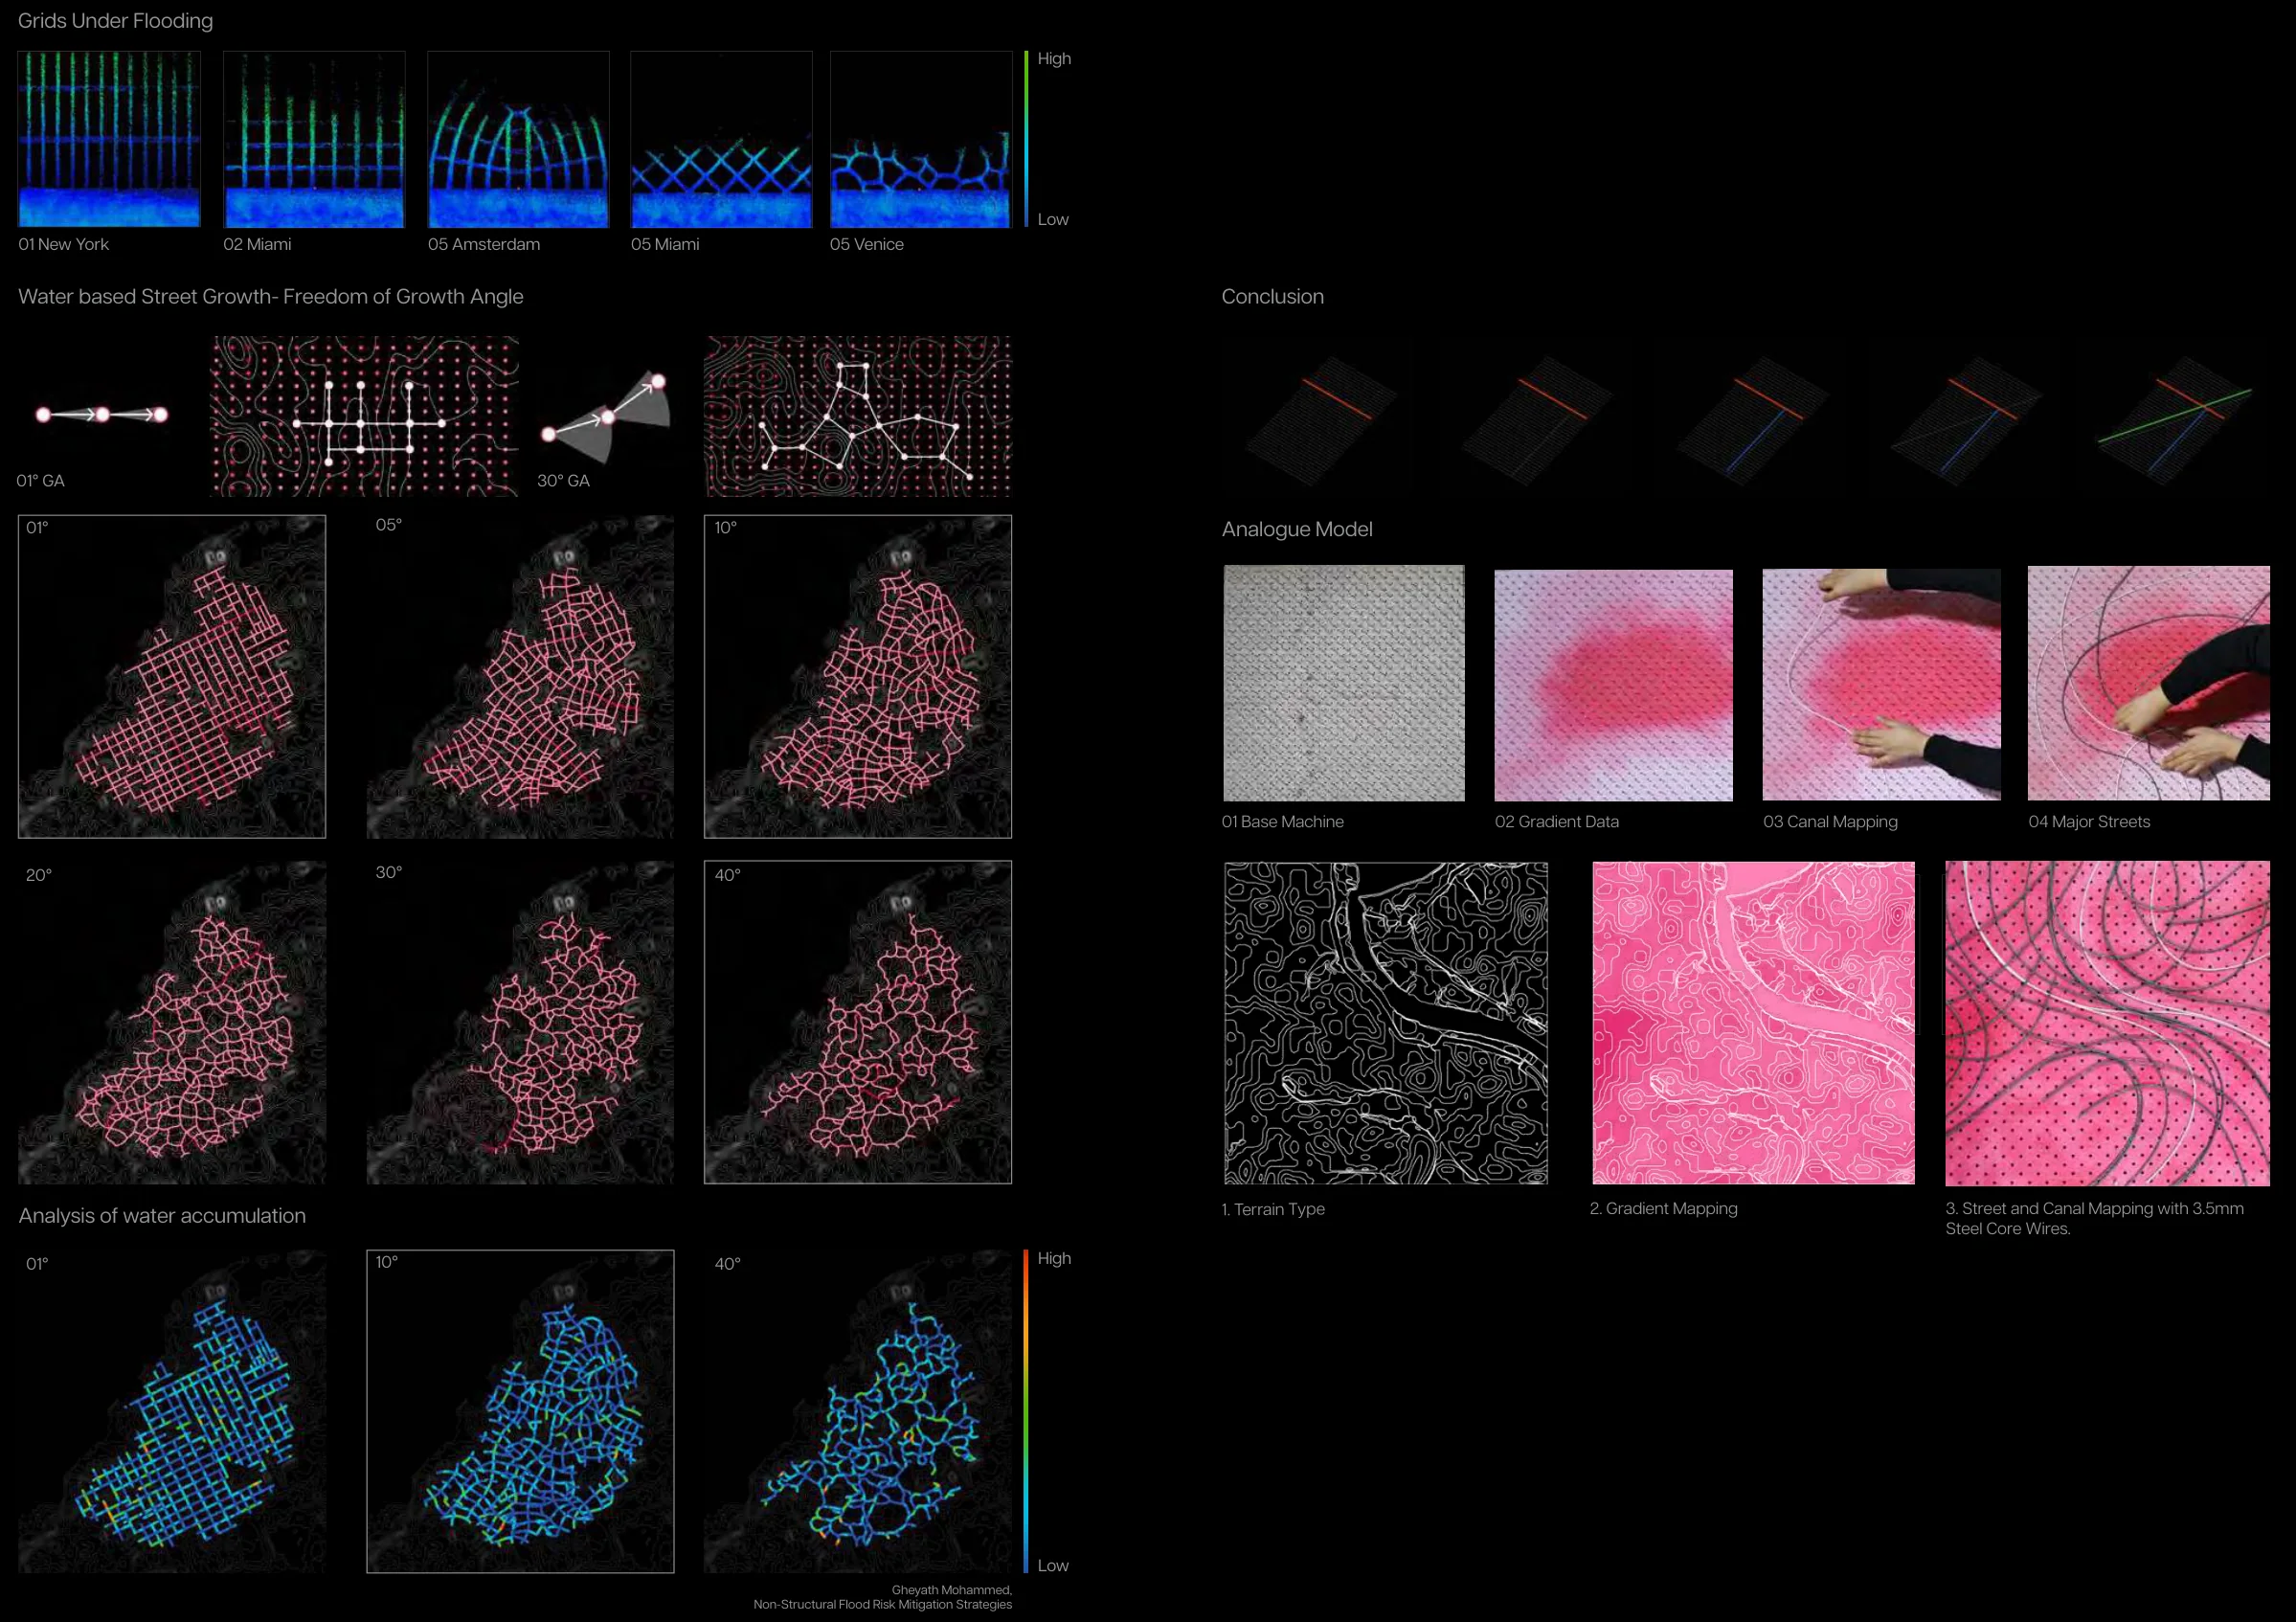 Open original image separately
The simulation is translated into building types ranging from the water’s edge to higher ground: elevated roads and buildings on stilts near water, grounded buildings inland.
Reading: Read building types against ground and water conditions, not as tested construction specifications.
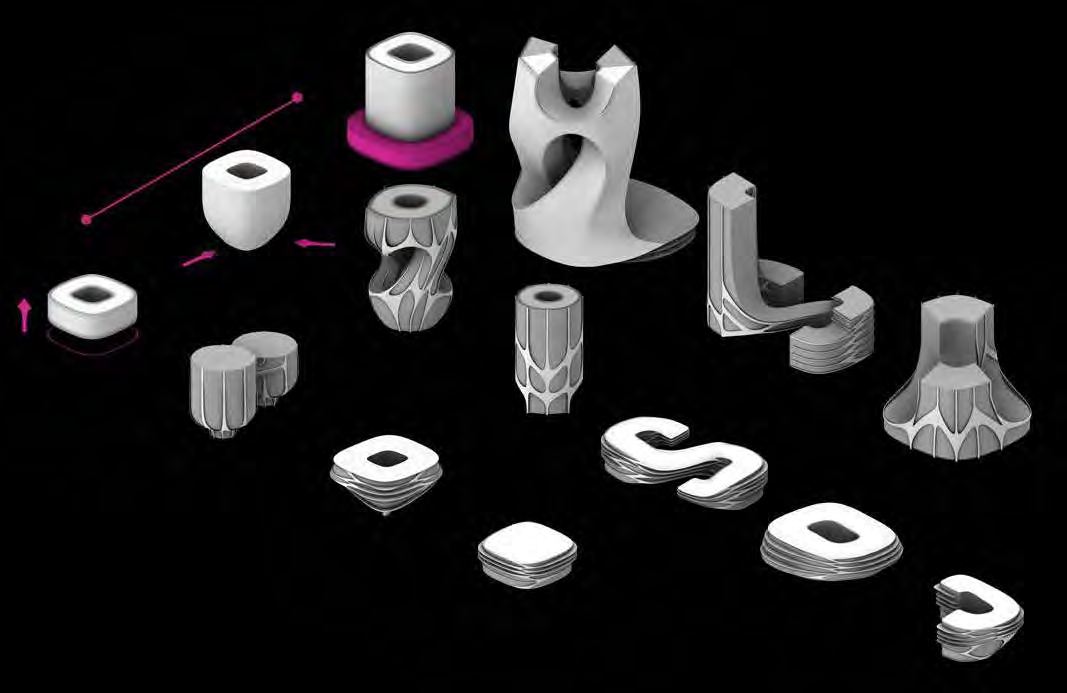
Building types respond to their distance from the water.
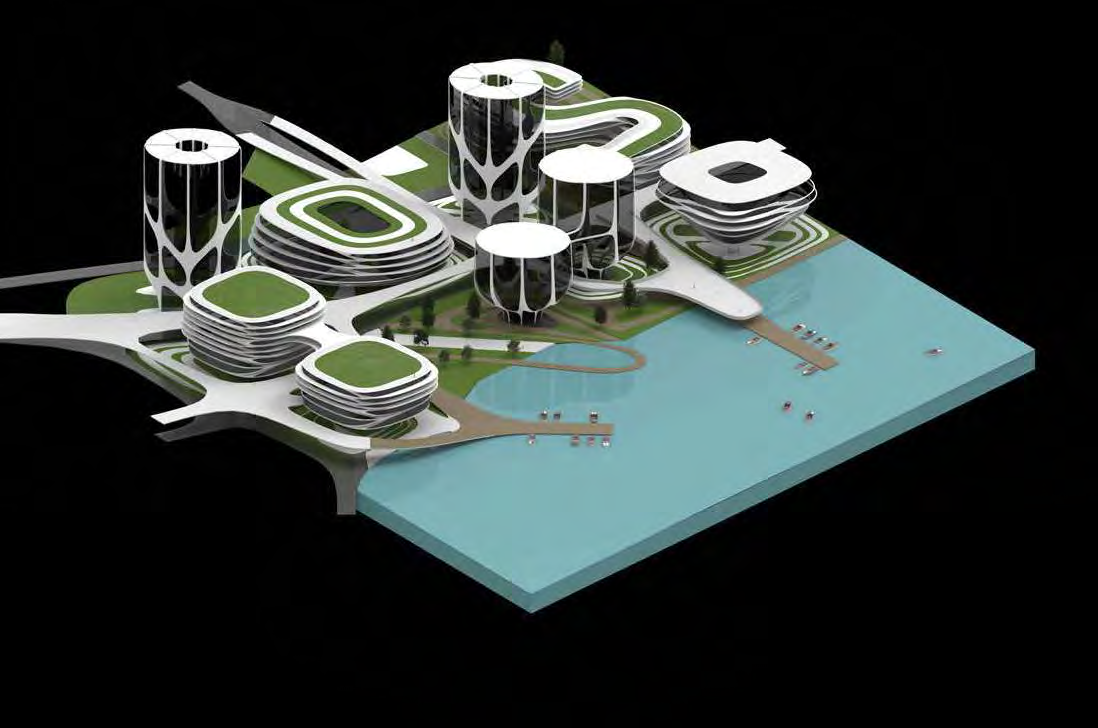
Building types are combined with routes and a shared waterfront.
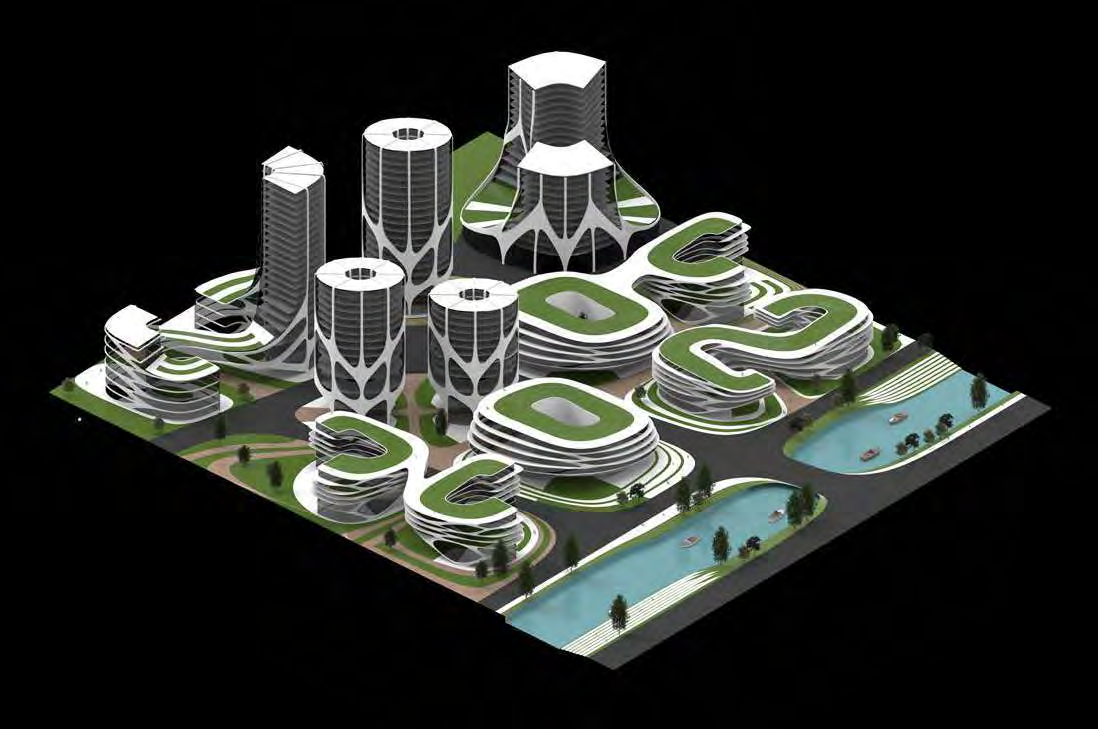
A second arrangement using the same building types.
Portfolio page 5 · Project visualisations from the original portfolio.
Open the complete original plateEconomic and environmental rules become alternative metropolitan assemblies and a waterfront design. These are project visualisations, not built work.
Reading: Read the waterfront as an assembled design, not evidence of a built or occupied city.
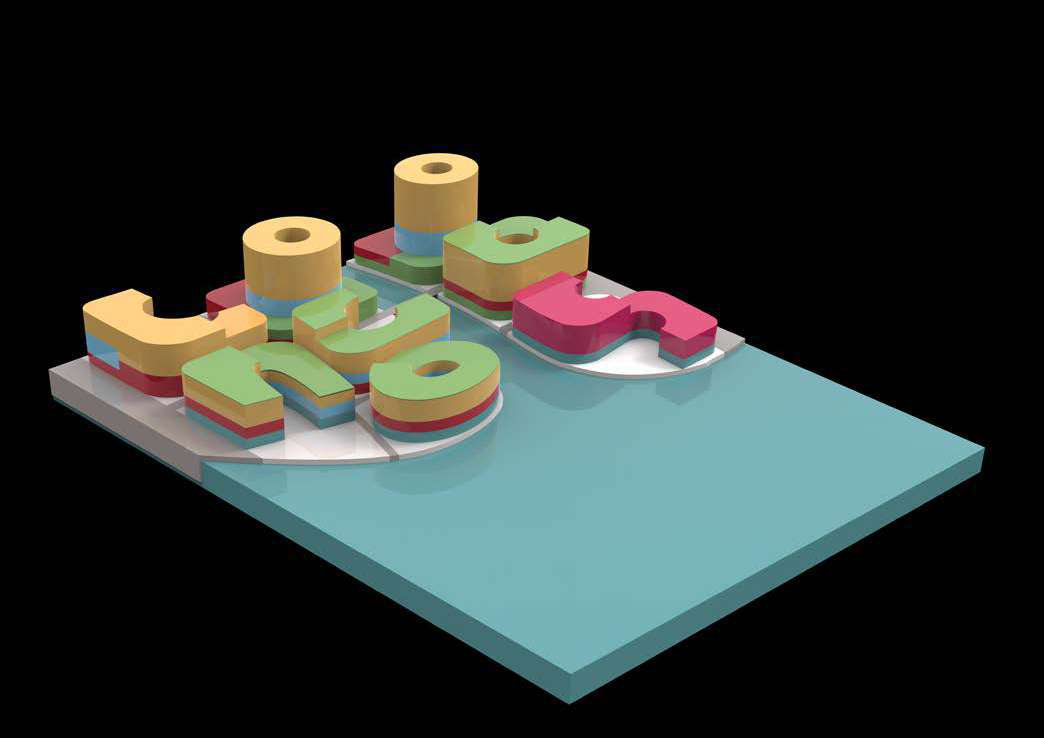
The game establishes an initial arrangement of uses and building volume.
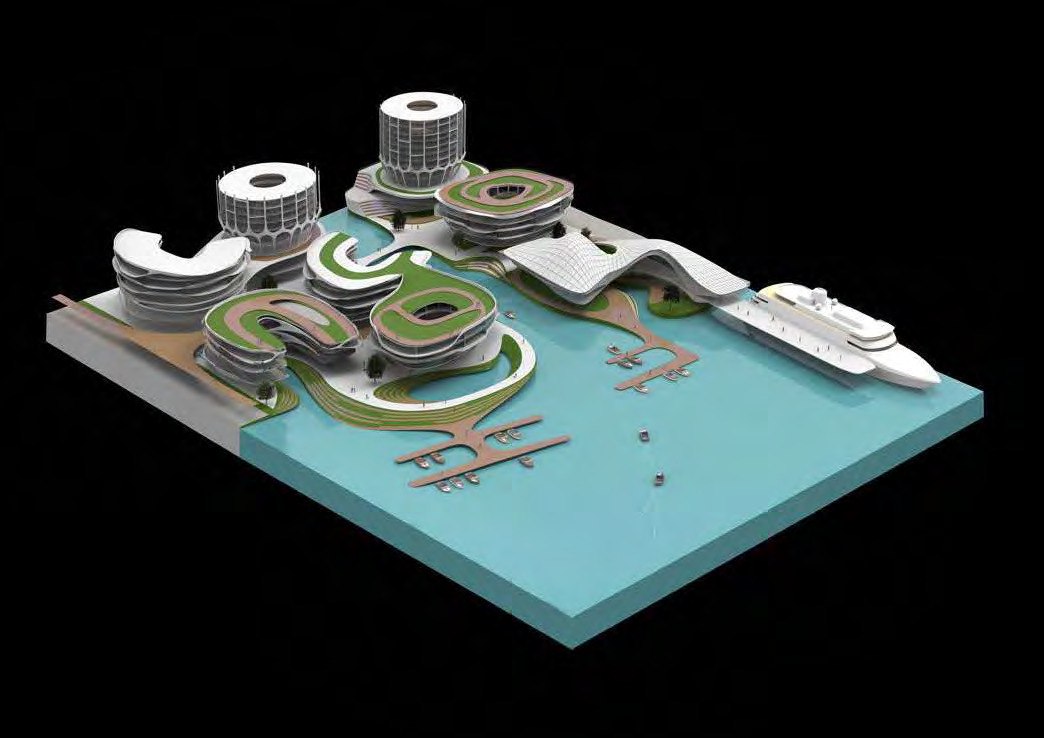
The initial arrangement is developed into buildings, landscape and routes.
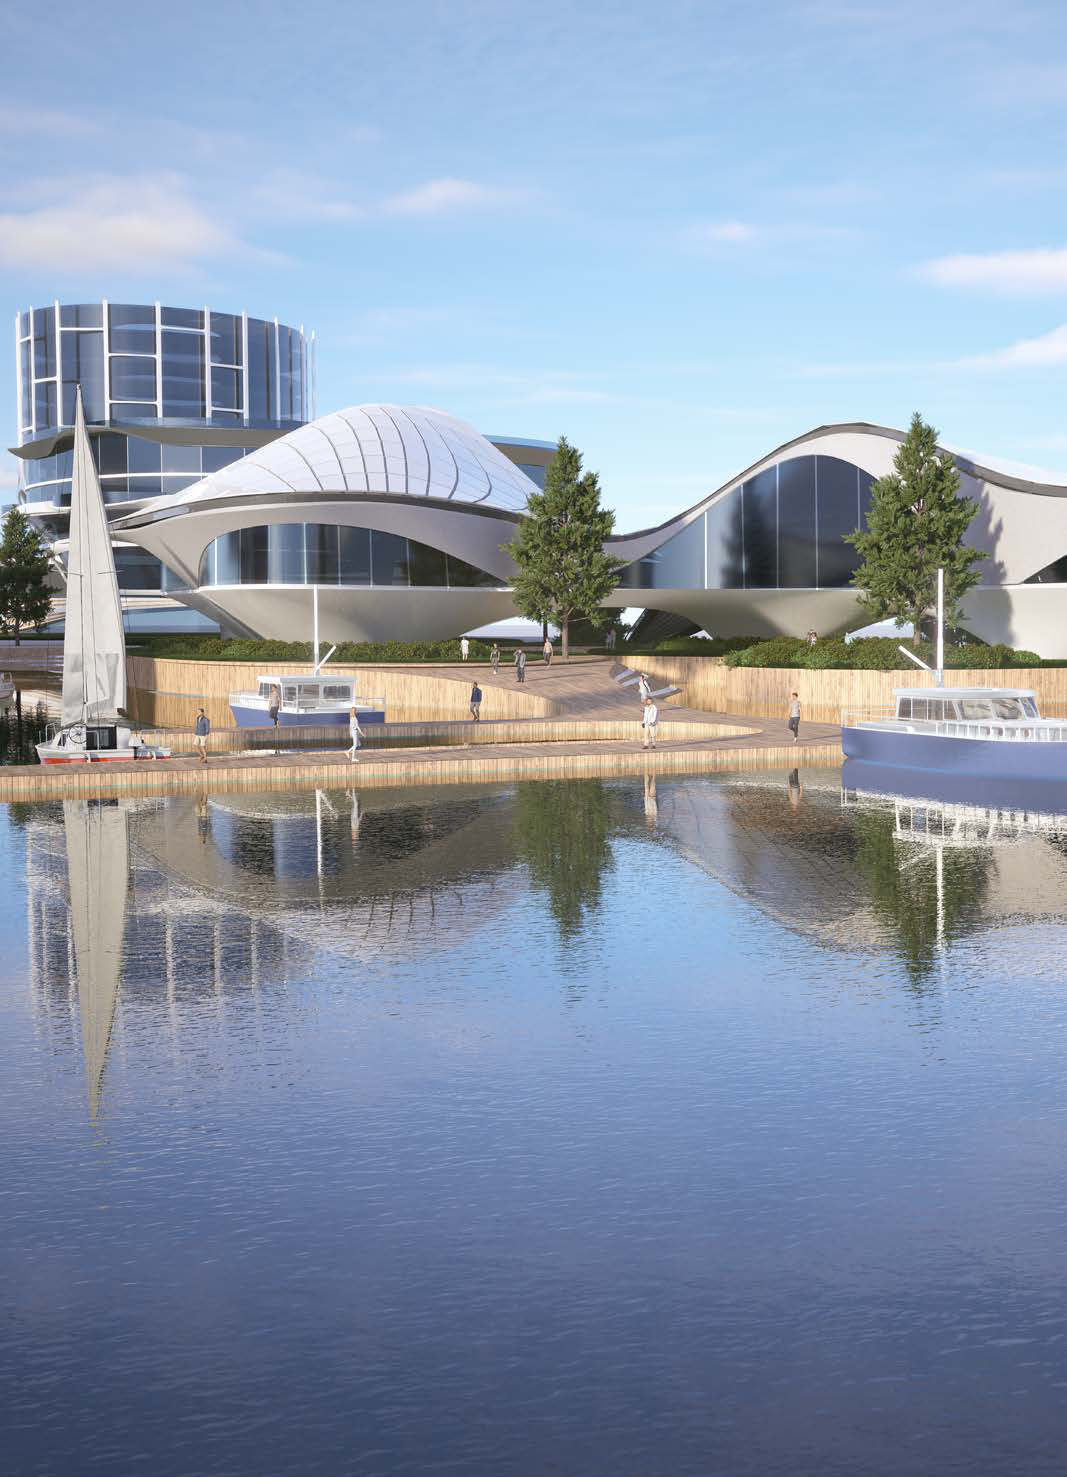
A project visualisation of the public waterfront—not a photograph of built work.
Portfolio page 6 · Project visualisations from the original portfolio.
Open the complete original plateHere, resilience is treated as a negotiation between public investment, developer behaviour, water movement and spatial form.
Nishtha’s continued research
Working paper / SSRN / 2026
What changes when simulated developers learn from earlier decisions? Nishtha’s 2026 working paper studies how those choices reshape land use.
Development rules, water studies and architectural translation.
Learned developer decisions within a modelled economy.
Public studio presentation
The AA DRL presentation provides the longer spoken account of the team’s method and outcomes. It is supporting context for the six original project figures above.
Research contributors
Developed at the AA Design Research Laboratory. Nishtha’s contribution, as recorded in her portfolio, spans urban research and design, land-use simulation and spatial design.
Publication details
Ashwin Rajendran, Nishtha Gupta and Sidharth Tayal. “Resilient Metropoles.” Field Assembly, Issue 01. Published 1 August 2026; revised 14 September 2026. https://fieldassembly.press/resilient-metropoles.
In brief
Resilience must coordinate public investment, developer behaviour, water movement and spatial form across the metropolitan system.
What’s included The six-part simulation and water-testing sequence